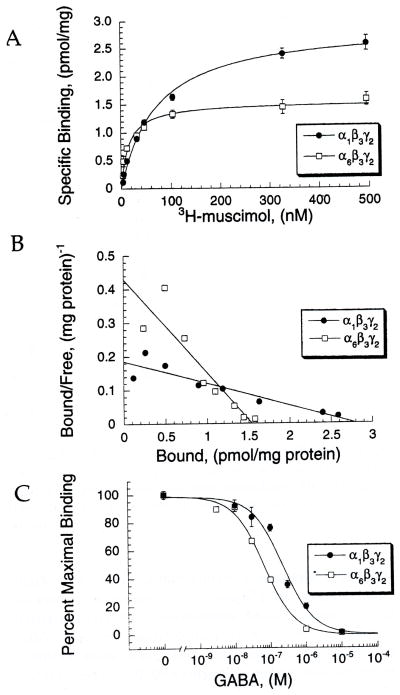
Fig. 2.
Binding affinity is higher for muscimol and GABA at α6β3γ2 than α1β3γ2. (A) Saturation binding isotherms for α1β3γ2 and α6β3γ2 receptors obtained by using increasing concentrations of [3H]muscimol. Data points show the means ± SEM from a single experiment, with each concentration performed in triplicate. This experiment was performed five times, with similar results. (B) Shows a Scatchard plot from the same experiment from (A). Data points are the means of triplicate measurements. (C) An inhibition curve showing displacement of 10 nM [3H]muscimol with increasing concentrations of GABA. This figure represents the means ± SEM from a single experiment, with each point performed in triplicate. This experiment was performed three times with similar results.

