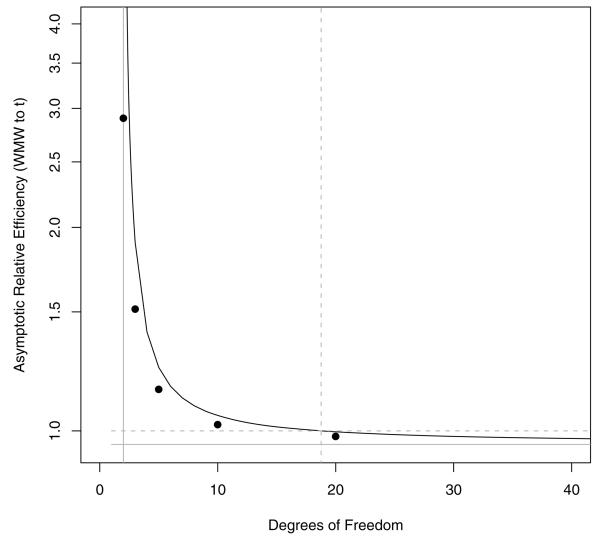
Fig 5.
Relative efficiency of WMW test to t-test for testing for location shift in t-distributions. The dotted grey horizontal line is at 1, and is where both tests are equally asymptotically efficient, which occurs at the dotted grey vertical line at 18.76. The solid grey lines denote limits, the vertical line shows ARE goes to infinity at df = 2, the horizontal line shows ARE goes to 3/π = .955 as df → ∞. Points are simulated relative efficiency for shifts which give about 80% power for the WMW DR when there are about 20 in each group.

