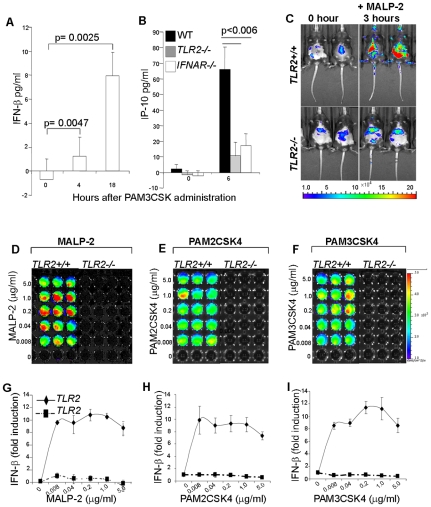
Figure 3. TLR2-driven IFN-β and type I IFN dependent responses in vivo.
A–B; Five mice per group WT, TLR2−/− and IFNAR−/− were injected with control medium or PAM3CSK4 (100 µg/mouse) then sacrificed at different time points between 0–18 hours and their sera (A) or peritoneal exudates (B) analyzed by ELISA for IFN-β and IP-10 respectively Data representative of two independent experiment show ± s.e.m. C; Three mice per group of TLR2+/+IFN-β+/Δ-luc (TLR2+/+) and TLR2−/−IFN-β+/Δ-luc (TLR2−/−) mice were injected with MALP-2 (100 µg/mouse) and expression of luciferase was monitored for 24 h by luminescence imaging. C shows two representative mice out of a group of four mice before (0 hours) and after (3 hours) MALP-2 administration. Fold increase and kinetics of luciferase induction of corresponding mice are depicted in Fig. S2A. D–I; TLR2 mediated IFN-β induction in macrophages. Macrophages matured from bone marrows of TLR2+/+IFN-β+/Δ-luc or TLR2−/−IFN-β+/Δ-luc mice were stimulated with indicated concentrations of MALP-2 (D, G) or PAM2CSK4 (E, H) or PAM3CSK4 (F, I) for 4 hours and analyzed for luciferase expression. D–F; show representative luminescence images of macrophages while G–I indicate the fold increase in luciferase in corresponding cells. Luciferase expression is represented by a colour shift from blue to red. Similar results were obtained from three independent experiments (mean ± s.e.m). Note that the background response in reporter mice, mainly in the liver region, might be due to the liver's role in trapping and detoxifying noxious substances from the system. Such substances and the metabolic products thereof could account for the higher MALP-2 associated background in TLR2−/− mice.

