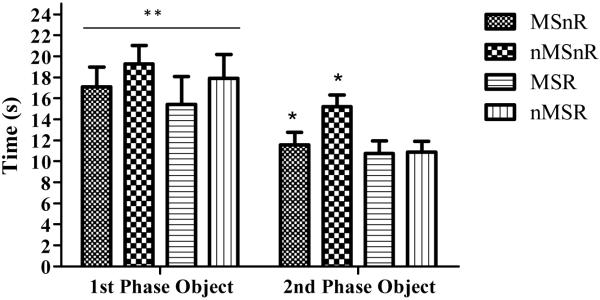
Figure 5.
Graph showing mean time spent ±SEM with the object from the 1st phase and the object from the 2nd phase of the temporal order task. Factorial ANOVA revealed that non-exercised rats spent a greater amount of time with the object from the 2nd phase in comparison to the exercised rats, * p < 0.05 (MSnR and nMSnR compared to MSR and nMSR). All rats spent significantly more time with the object from the 1st phase in comparison to the object from the 2nd phase, ** p < 0.01.

