
Fig. 3.
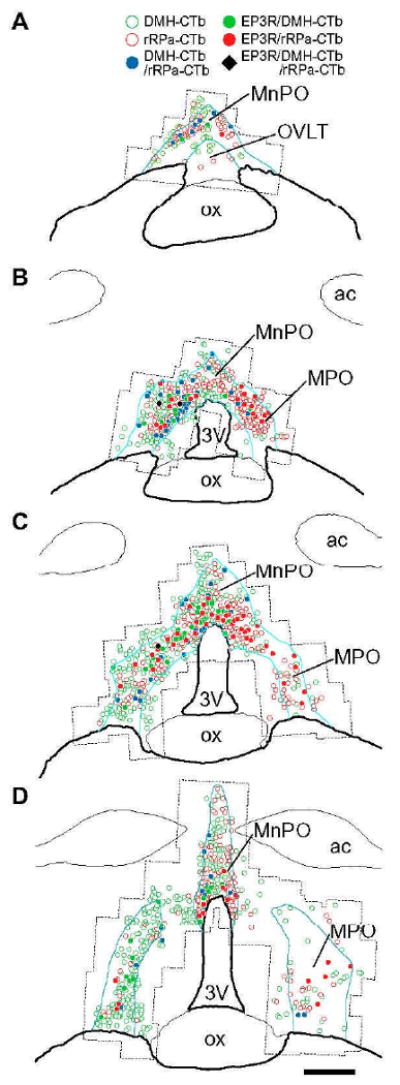
Distribution of CTb-labeled neuronal cell bodies with or without EP3R immunoreactivity in the POA. Drawings of POA sections from the animal #21 are shown in a rostrocaudal order (A–D). Blue lines delineate EP3R-immunoreactive regions. Dotted lines outline the areas that were scanned with a confocal microscope. The left side is ipsilateral to the CTb injection into the DMH. ac, Anterior commissure; ox, optic chiasm. Scale bar=0.5 mm.