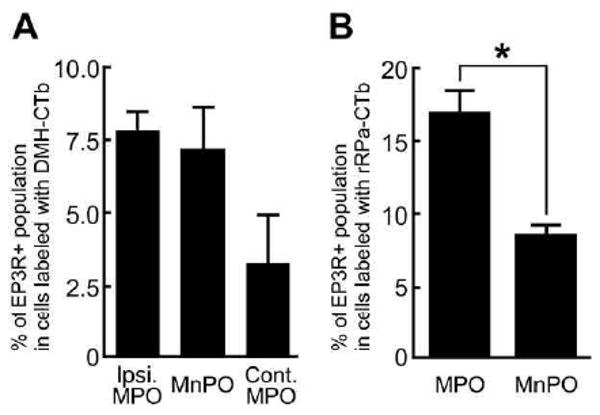
Fig. 4.

Percentages of EP3R-immunoreactive neurons in DMH-CTb-labeled (A) and rRPa-CTb-labeled (B) populations in POA subregions. CTb-labeled cells in the EP3R-immunoreactive regions were counted in every sixth 25-mm-thick frontal section throughout the POA. The POA was divided into three subregions in (A): the MnPO and the MPO ipsilateral (Ipsi. MPO) and contralateral (Cont. MPO) to the unilateral CTb injection into the DMH, and into two subregions in (B): the MnPO and the MPO. The data represent the mean±SEM (n=3). * P<0.05, paired t-test.
