
Fig. 2.
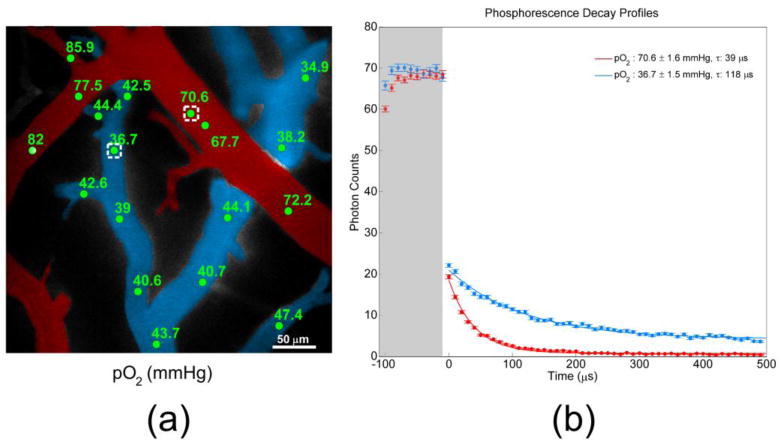
(a) Color-coded angiogram of pial microvasculature from an exposed cranial window. Arterioles are indicated in red, and venules are blue. Measured pO2 values (mmHg) at selected intravascular locations are indicated in green. (b) Phosphorescence decay profiles measured at points identified with white boxes in Fig. 2(a). Higher O2 concentration in the arteriole causes more quenching of phosphorescence signal, and consequently a faster decay (red profile).