
Fig. 4.
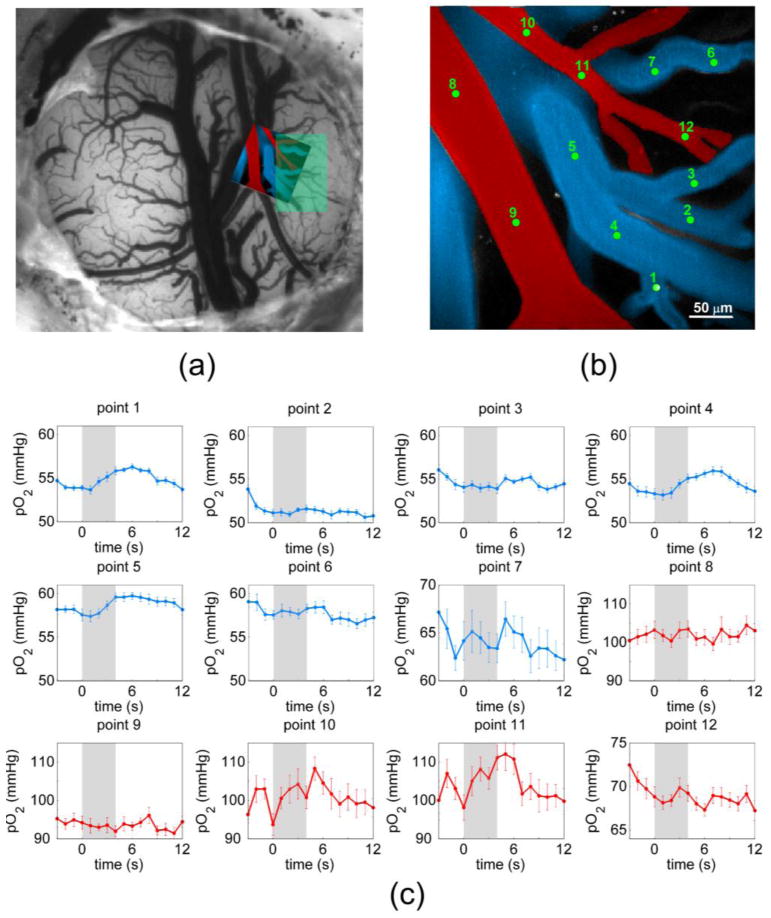
(a) CCD image of cranial window with confocal angiogram overlaid and region of functional activation identified in green (b) Color-coded angiogram of microvessels in rat somatosensory cortex, with identified locations for pO2 measurement. (c) Temporal profiles of pO2 during functional stimulation.