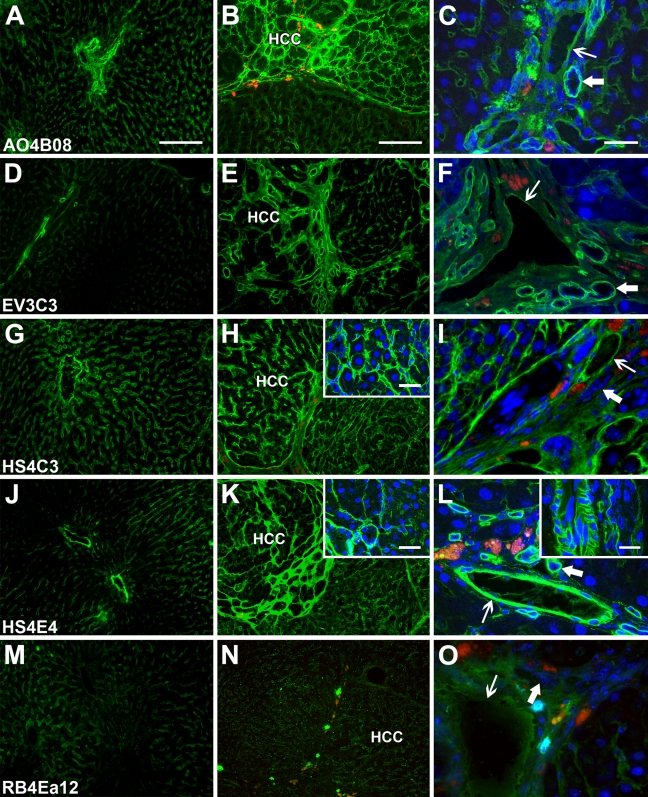
Figure 2.
Immunoreactions of sulfation-specific anti-HS antibodies in normal and diseased rat liver. Left column shows healthy liver (A,D,G,J,M); middle column shows cirrhosis with hepatocellular carcinoma (HCC) nodules (B,E,H,K,N); right column shows nonparenchymal structures (C,F,I,L,O). Thin arrows, blood vessels; thick arrows, bile ducts. Bars: A,B = 250 μm (left and middle column main panels); C = 50 μm (right column main panels); H,K,L insets = 50 μm.

