Figure 2.

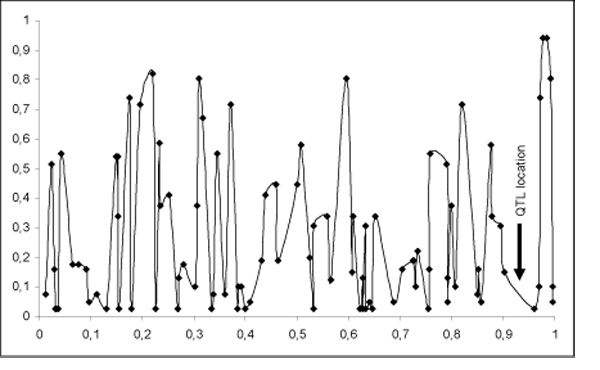
Chromosome 3 markers informativity in the population. The informativity values correspond to the average of transmission probabilities at the SNP location. The arrow highlight the location of the QTL detected at 92cM.

Chromosome 3 markers informativity in the population. The informativity values correspond to the average of transmission probabilities at the SNP location. The arrow highlight the location of the QTL detected at 92cM.