
Figure 1.
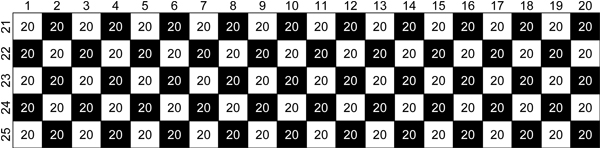
Graphical representation of simulated generation 1,002. Cell i,j represent the full sib family simulated by mating female i to male j. Black cells represent full sib families of which phenotype data was simulated; white cells represent full sib families of which phenotype data was simulated. Each full sib family consisted of 20 individuals.