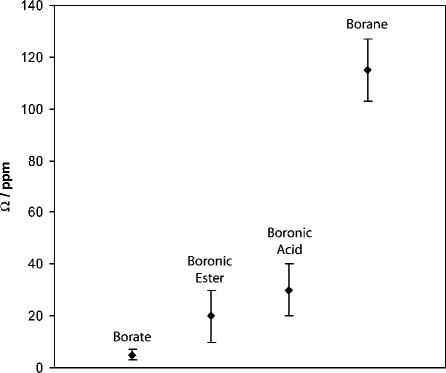
Figure 10.
Graphical representation of experimental Ω values for the compounds being studied (Table 1) and different borate and borane compounds.(50) Data points indicate average values for a range of compounds (boronic acids and esters) or single experimental measurements (borate and borane). The vertical bars for the boronic acid and ester data show the range of Ω for each class of compound. In the case of borane and borate, the vertical bars represent the experimental measurement error for one compound (trimesitylborane and triphenylborate).(50) As the central boron atom is bound to more oxygen atoms and fewer carbon atoms, the experimental Ω values decrease dramatically. See text for further discussion.

