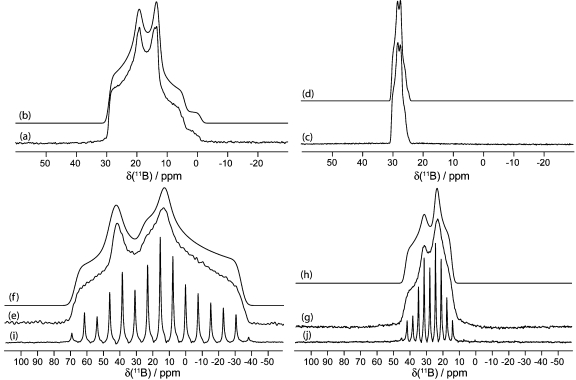
Figure 2.
Solid-state boron-11 NMR spectroscopy of 8. Experimental spectra of a powdered sample undergoing MAS are shown in (a) 11B at 9.40 T and (c) 11B at 21.1 T. Best-fit spectra were simulated using WSolids (traces (b) and (d)) using the parameters given in Table 1. Experimental spectra of stationary powdered samples are shown in (e) 11B at 9.40 T and (g) 11B at 21.1 T. Best-fit spectra were simulated using WSolids (traces (f) and (h)) using the parameters given in Table 1. Experimental QCPMG spectra of stationary powdered samples are shown in (i) 11B at 9.40 T and (j) 11B at 21.1 T.

