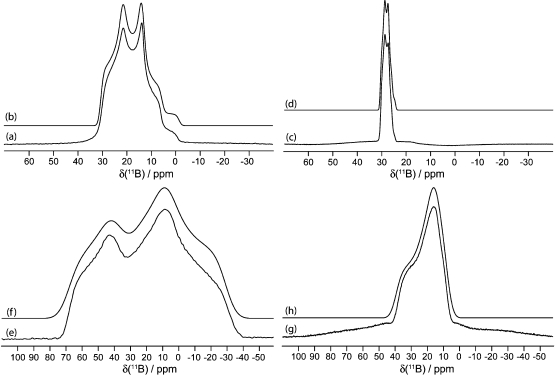
Figure 6.
Solid-state boron-11 NMR spectroscopy of 4. Experimental spectra of a powdered sample undergoing MAS are shown in (a) 11B at 9.40 T and (c) 11B at 21.1 T. Best-fit spectra were simulated using WSolids (traces (b) and (d)) using the parameters given in Table 1. Experimental spectra of stationary powdered samples are shown in (e) 11B at 9.40 T and (g) 11B at 21.1 T. Best-fit spectra were simulated using WSolids (traces (f) and (h)) using the parameters given in Table 1.

