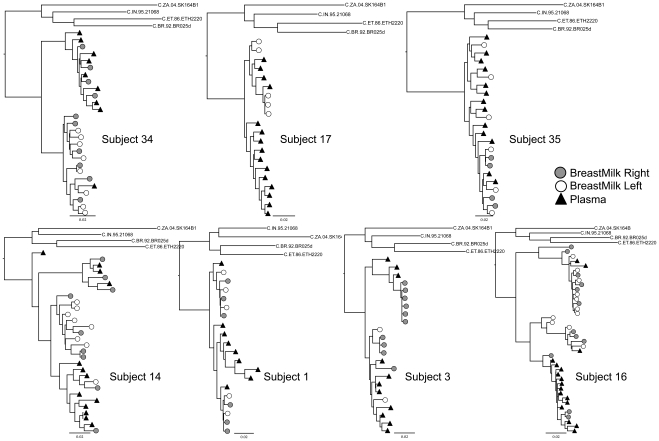
Figure 3. Maximum likelihood trees of region gp160, PL samples obtained previous to BM samples.
All trees were calculated under the GTR+G+I model, rooted with 4 subtype C reference sequences obtained from LANL sequence database. In all subjects, HIV-1 RNA sequences from the left breast (white circles) and from the right breast (gray circles) were intermixed. The scale at the bottom left of each tree corresponds to the number of substitutions per site (for example, 0.01 = 1 substitution per 100 sites).

