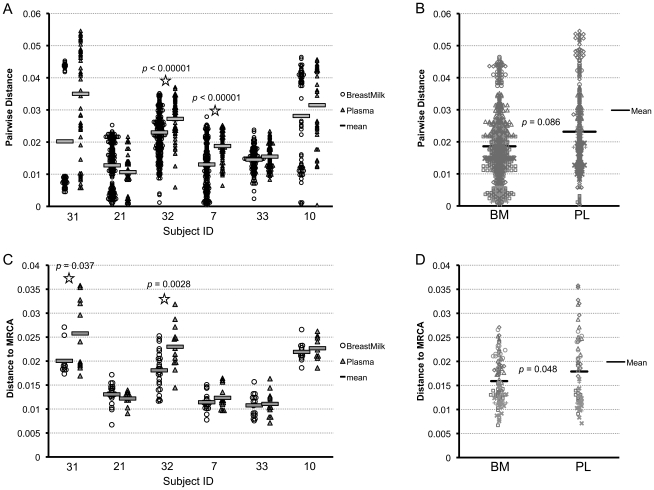
Figure 5. Diversity and divergence in breast milk and plasma.
(A) Comparing mean diversity of virus in breast milk and plasma HIV-1 RNA gp160 sequences of contemporaneously sampled subjects. Triangles = plasma, circles = breast milk; star = significant difference between plasma and breast milk diversity, p-values from Wilcoxon rank sums test. (B) Comparing diversity in breast milk and plasma in all contemporaneously sampled patients in aggregate, using Gilbert, Rossini, and Shankarappa's method for comparing intra-individual genetic sequence diversity between populations. Black lines are means. (C) Comparison of mean divergence of virus in BM and PL within contemporaneously sampled subjects. P-values from Wilcoxon rank sums test. (D) Comparison of viral divergence between the BM and PL of all contemporaneously sampled subjects in aggregate. P-value obtained using a GEE model. Black lines are means.

