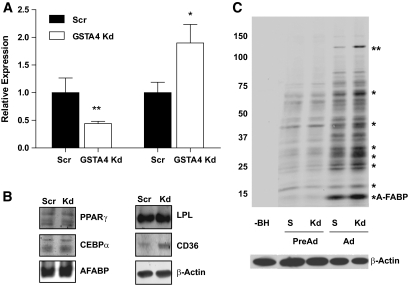
FIG. 4.
GSTA4 silencing and protein carbonylation in 3T3–L1 adipocytes. A: Relative levels of GSTA4 and GSTA3 mRNA were quantified by qPCR (n = 6 per group). GSTA4 expression was normalized to TFIIE, and GSTA3 expression was normalized to 36B4. B: Expression of adipogenic marker proteins (n = 6 per group). C: Protein carbonylation in GSTA4 knockdown and Scr control cells. Protein bands found to have increased carbonylation in the GSTA4 knockdown adipocytes are indicated (*). The ∼145-kDa band (**) was digested and subjected to liquid chromatography–electrospray ionization tandem mass spectrometry for protein identification detailed in supplementary Table 2. S, scrambled, −BH, minus biotin hydrazide. C: A composite in which the −BH lane has been moved from the same digital image (at the same exposure) to be adjacent to the experimental lanes.

