FIG. 6.
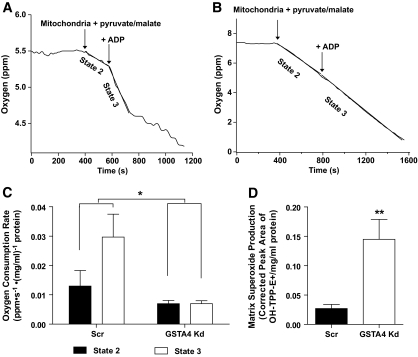
Mitochondria function in GSTA4 knockdown and Scr 3T3–L1 adipocytes. Mitochondrial oxygen consumption in Scr (A) or GSTA4 knockdown (B) adipocytes. C: Oxygen consumption rates for Scr and GSTA4 knockdown adipocytes (n = 3). Statistics calculated by two-way analysis with Bonferroni post hoc analysis. D: Mitochondrial matrix superoxide production in GSTA4 knockdown and Scr adipocytes (n = 3).

