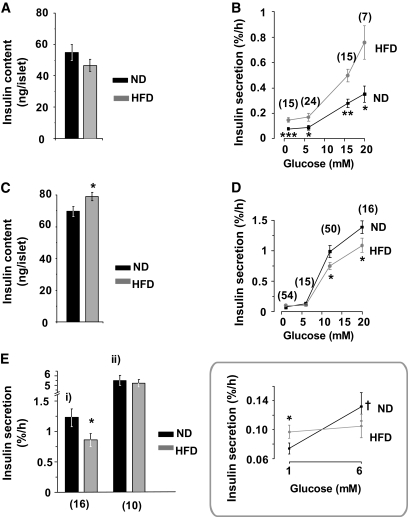
FIG. 2.
Effects of HFD on GIIS in vitro. A–E: Insulin content (A and C) and insulin secretion (B, D, and E) in ND (black) and HFD (gray) islets. Data are from mice fed ND or HFD for 3 (A and B) and 15 (C–E) weeks. B and D: The islets were challenged with glucose at the indicated concentrations. Ei: Islets were stimulated by 0.2 mmol/l tolbutamide in the presence of 12 mmol/l glucose. Eii: Islets were stimulated by 70 mmol/l KCl in the presence of 20 mmol/l glucose. D inset: The data highlighted within the box compare insulin secretion at 1 and 6 mmol/l in ND and HFD islets. The number below each point represents the minimum number of cases in that group. At least four different animals were used in each group. Data are mean values ± SEM. *P < 0.05, **P < 0.005, ***P < 0.0005 for differences between ND and HFD. †P < 0.05 indicates difference between 6 and 1 mmol/l glucose. Numbers in parentheses in (B, D, and E) are number of experiments performed.

