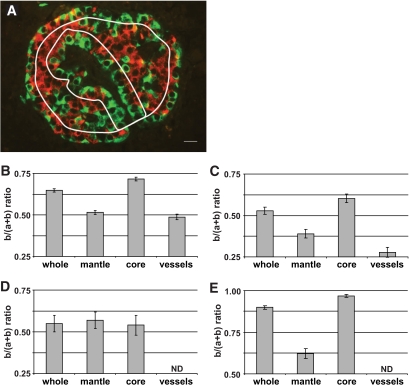
FIG. 2.
Distribution of α- and β-cells according to different defined islet subregions. A: Pancreatic islet labeled by immunofluorescence for insulin (red) and glucagon (green); rims (white lines) delimiting mantle and core subregions and one vascular channel area are shown; scale bar, 10 μm. After immunofluorescence, areas labeled for insulin (b) and glucagon (a) were measured and results expressed as b/(a+b) ratio. This ratio was calculated for areas measured in the different subregions (mantle, core, and vessels) and in the whole islets (whole). Analyses were performed on histologic sections from nondiabetic human (B), type 2 diabetic human (C), and control mouse (E) pancreata and cultured isolated human islets (D). Columns are means ± SEM. B: n = 193 islets from 16 pancreata. C: n = 54 islets from five pancreata. D: n = 20 islets from two pancreata. E: n = 50 islets from one pancreas. ND, not determined. (A high-quality digital representation of this figure is available in the online issue.)

