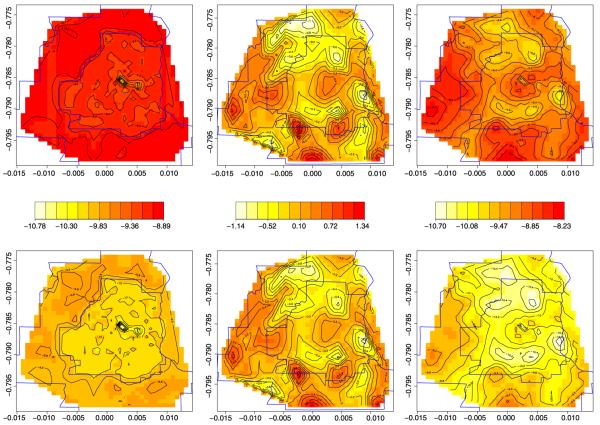
Fig. 4.
Log-relative intensity surfaces using values at centroid of each census tract at the mean age and assuming an early diagnosis. The top row is for colon cancer and the bottom for rectum cancer. The first column is the log-relative intensity surfaces without spatial residuals. The second column is the spatial residuals and the third is the complete log-relative intensity surfaces.

