Figure 1.
V3D visualization.
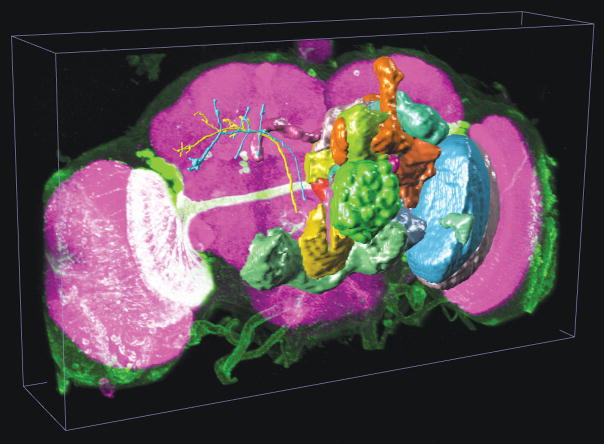
(a) The use of V3D in visualizing a 3D digital model of a fruit fly brain. Magenta voxels: the 3D volumetric image of a fruit fly brain; green voxels: a 3D GAL4 neurite pattern; colored surface objects of irregular shapes: digital models of various brain compartments; colored tree-like surface objects: 3D reconstructed neurons.
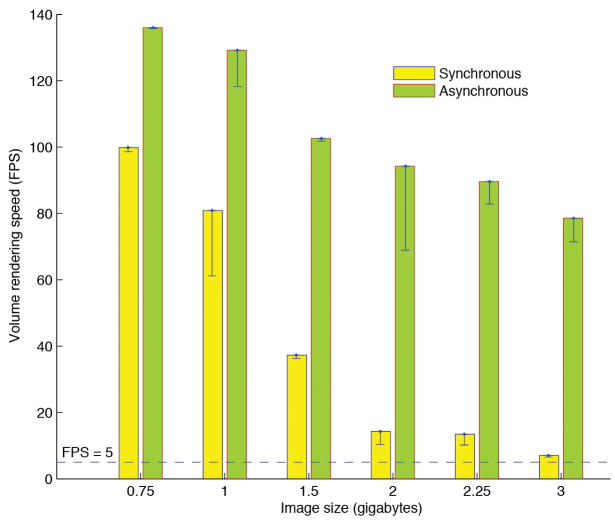
(b) The volumetric image rendering speed of V3D visualization engine under synchronous and asynchronous modes. For each image size, both the peak speed (green and yellow bars) and the respective standard deviation (black line-ranges) of at least 10 speed-test trials are shown. The tests were done on a 64bit Redhat Linux machine with a GTX280 graphics card.
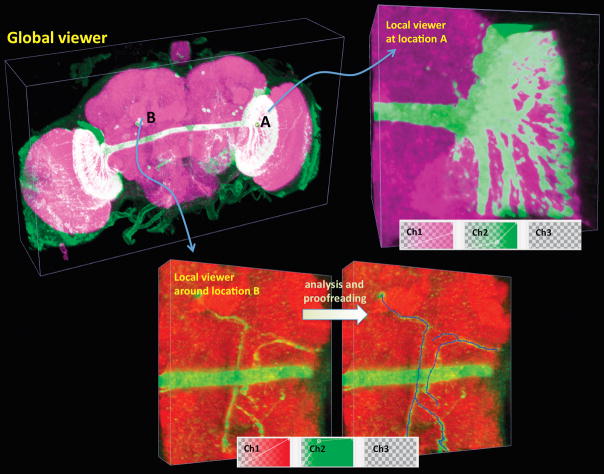
(c) V3D hierarchical visualization and analysis. Local 3D viewers of different brain regions can be conveniently initialized from the global viewer. Local viewers can have their own color maps and surface objects independent of the global viewer. They can also be used to analyze sub-volumes of an image separately.


