
Figure 2.
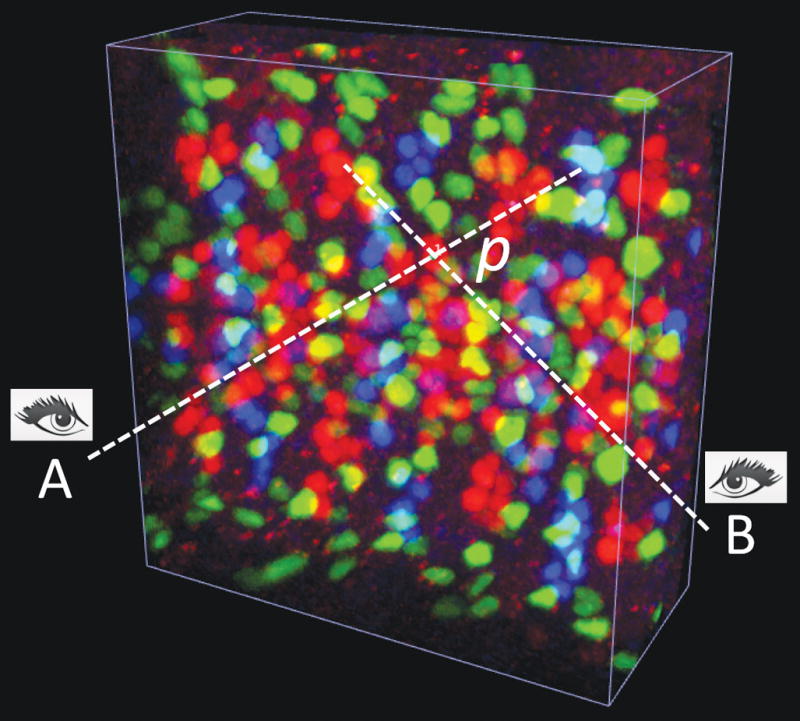
3D pinpointing methods of V3D.
(a) 3D pinpointing using 2 mouse-clicks. The color image is a 3D confocal image of neurons, fluorescently tagged for three different transcriptional factors (repo, eve, and hb9) at the same time, in a fruit fly embryo. A and B: non-parallel rays generated at two viewing angles, corresponding to two mouse-clicks; p: the estimated 3D location that is closest to both A and B.
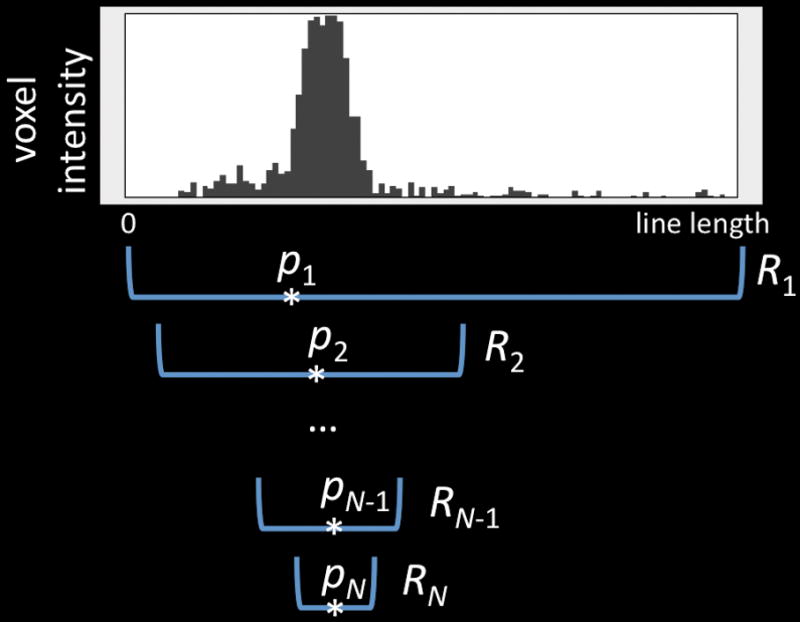
(b) 3D pinpointing using 1 mouse-click. p1 to pN: the progressively estimated centers of mass; R1 to RN: the progressively smaller intervals to estimate p1 to pN.