
Figure 6.

An atlas of stereotyped neurite tracts in a fruit fly brain.
(a) Statistical models of the 3D reconstructed neurite tracts. Grayscale image: a fruit fly brain; each colored tubular structure: the average of multiple neurite tracts reconstructed from images of the same GAL4 line. The width of the each tract equals twice of the spatial variation of the respective group of reconstructions.
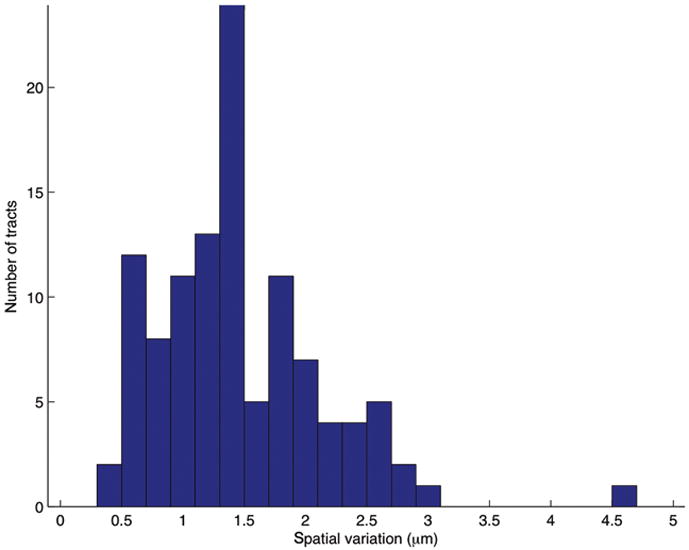
(b) Distribution of the spatial variation of all neurite tracts.