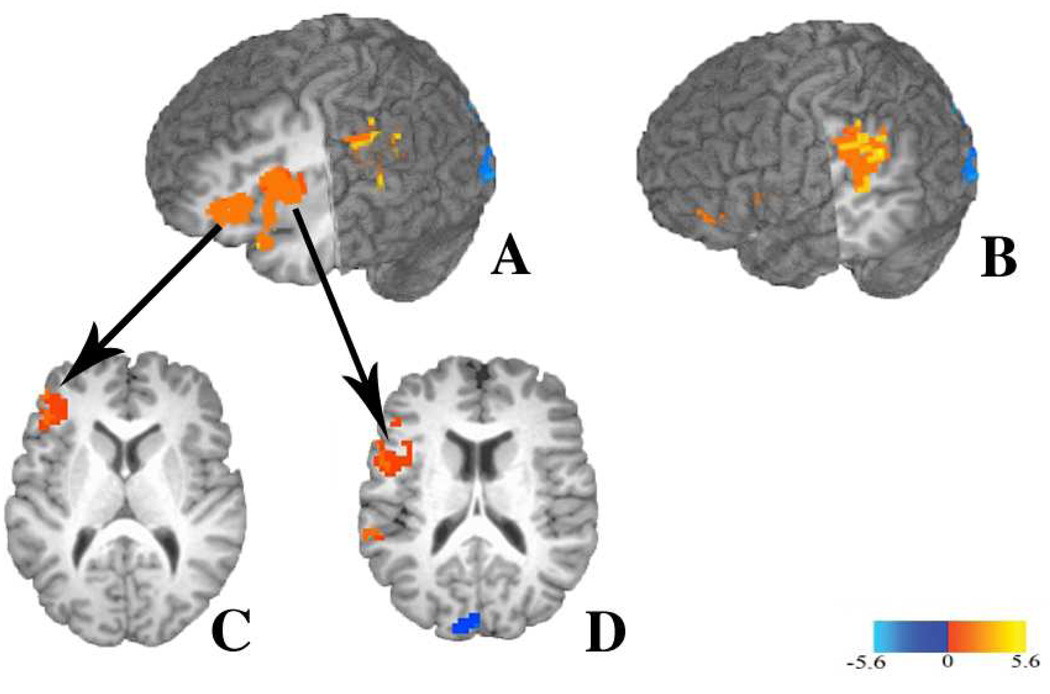
Figure 3.
Maps thresholded at a voxel-level threshold of P < 0.025, t = 2.459, and clusters shown correspond to a corrected significant level of p< 0.025. (A) Clusters in the left inferior frontal gyrus showing greater activation for competitor trials compared to no-competitor trials. Sagittal slice shown at x = 35, and coronal cut shown at y = 15. (B) Cluster in the left inferior frontal gyrus (BA 45). Axial slice shown at z = 11. (C) Cluster in the left inferior frontal gyrus (BA 44/45). Axial slice shown at z = 17. (D) Cluster in the left temporo-parietal region showing greater activation for competitor trials compared to no-competitor trials. Sagittal slice shown at x = 50, coronal slice shown at y = 20.

