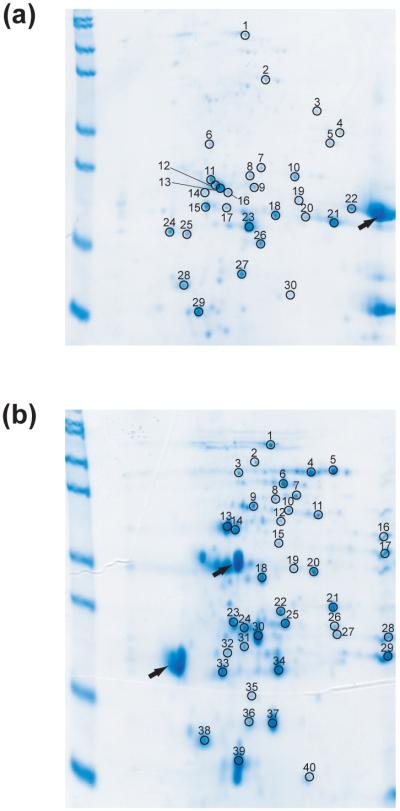
Figure 3. Identification of survivors by 2-D electrophoresis.
E.coli soluble fraction digested with 0.40 mg/mL trypsin (A) or 0.40 mg/mL thermolysin (B) for 4 days were analyzed by 2-D electrophoresis. The numbers on the gels indicate the spots analyzed by in-gel digestion and mass spectrometry. The identity of the protein in each spot is listed in Table 1. Black arrows indicate spots corresponding proteases.

