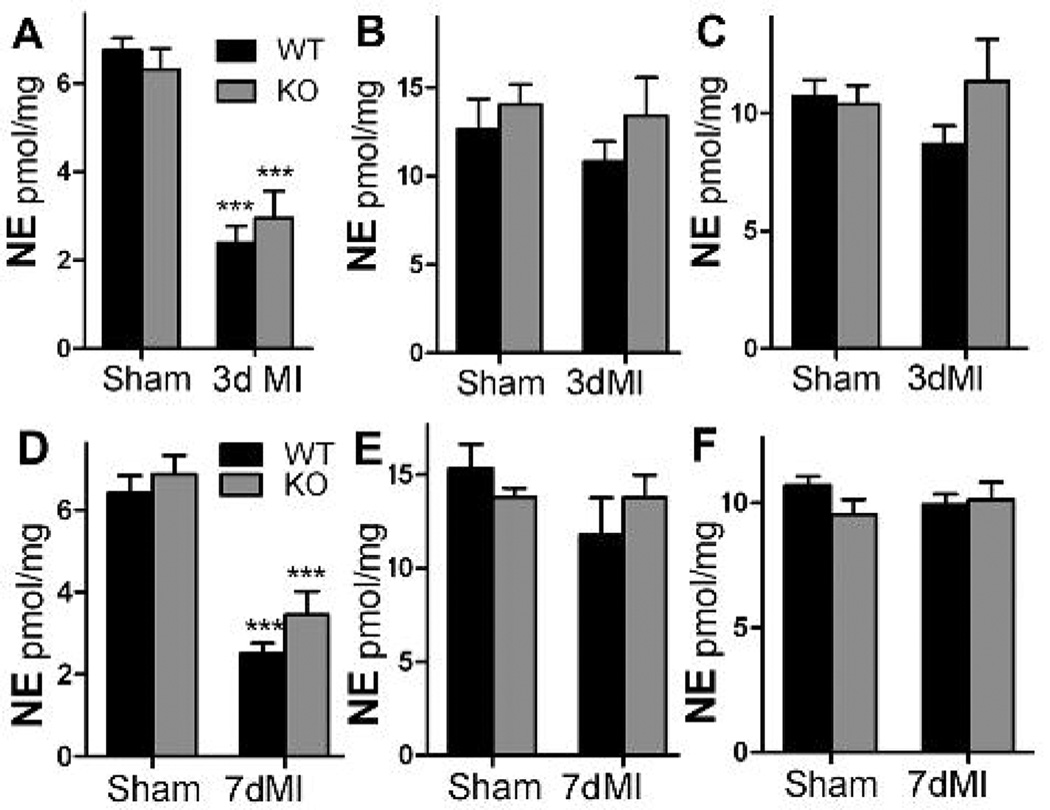
Figure 4.
NE content in WT and KO hearts. Black bars are WT, grey bars are KO mice. NE content in the left ventricle below the occlusion (A,D), the base of the ventricles (B,E), or the right ventricle (C,F) 3 or 7 days after sham or ischemia-reperfusion surgery. Data are Mean±SEM, n=6, *** p< 0.001.

