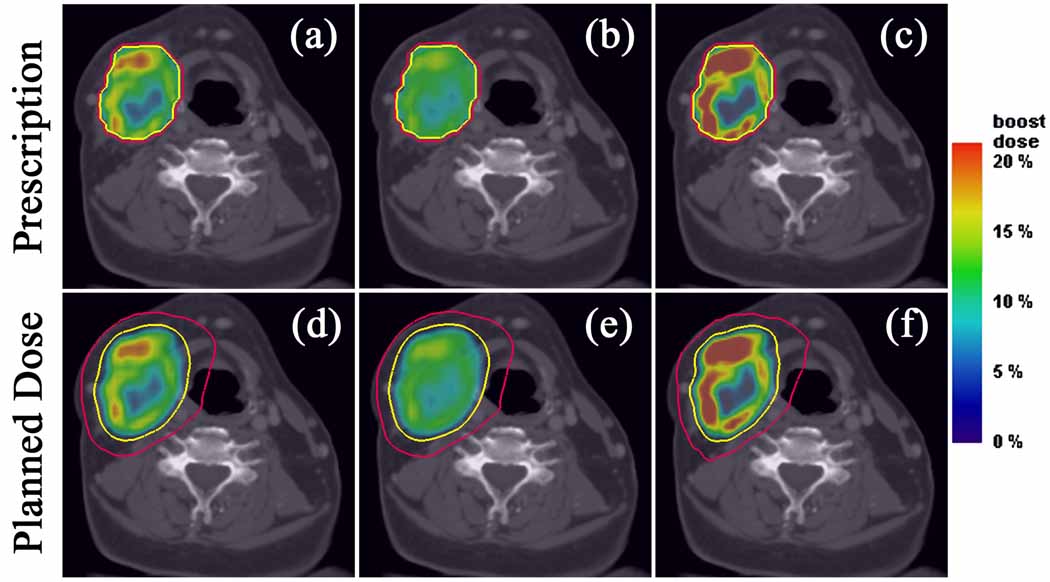
Figure 4.
Axial target dose boost distributions from prescriptions for the complex HNSCC patient. Linear (a), square root (b), and quadratic (c) prescriptions and their respective plans (d–f), along with isodose lines of 70 Gy (yellow) and 50 Gy (red). Note that the integral dose to the PTV remains constant but the magnitude of the dose gradients of the linear case decrease in the square root case and increase in the quadratic case.

