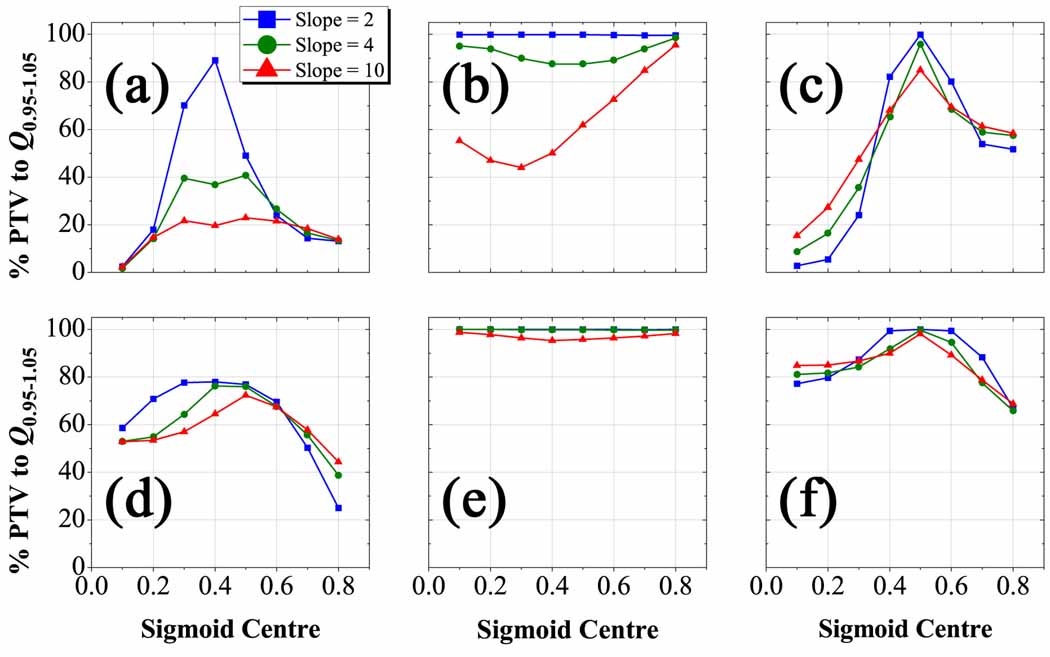
Figure 8.
Q0.95–1.05 plots for S m,hc plans from erroneous prescription functions in the complex HNSCC patient. Percent volume of PTV with voxels having planned dose within 5 % of their prescribed dose as a function of the parameter hc for Smax cases (a–c) and Sint cases (d–f). Conformity of plans was assessed from a presumed linear prescription (a,d), S m=2 prescription (b,e), and S hc =0.5 prescription (c,f). Note that planned dose conformity is more sensitive to changes in the threshold position than the sigmoid slope, but prescriptions that conserve integral dose to the target allow a greater margin of error in the choice of the mapping function.

