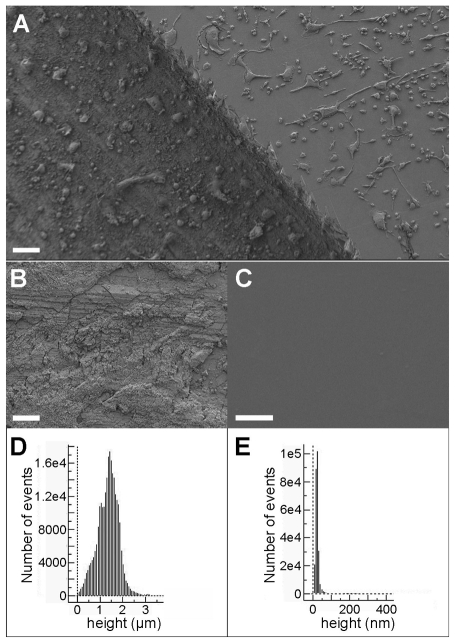
Fig. 1.
Smooth and rough calcite surfaces. (A) Scanning electron micrograph of osteoclasts on a half-smooth, half-rough surface. Scale bar: 100 μm. (B) Scanning electron micrograph of rough surface. Scale bar: 20 μm. (C) Scanning electron micrograph of smooth surface. Scale bar: 20 μm. (D) Histogram of height distribution on one representative 25 μm×25 μm rough surface. (E) Histogram of height distribution on one representative 25 μm×25 μm smooth surface.

