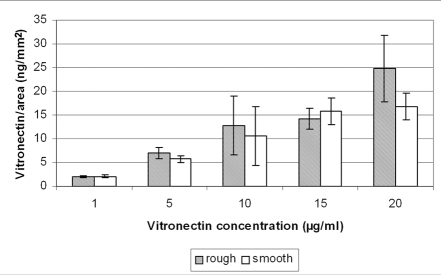
Fig. 4.
Vitronectin absorption per unit area on rough and smooth calcite as a function of the concentration of vitronectin used for incubation. Error bars represent standard deviations of measurements performed on four different crystals at each vitronectin concentration. At 10 μg/ml concentrations, vitronectin adsorption to smooth and rough calcite is similar; this is the concentration used in the experiments illustrated in Fig. 2. Note that a rough surface conditioned with 5 μg/ml vitronectin adsorbs much less than a smooth surface conditioned with 20 μg/ml vitronectin.

