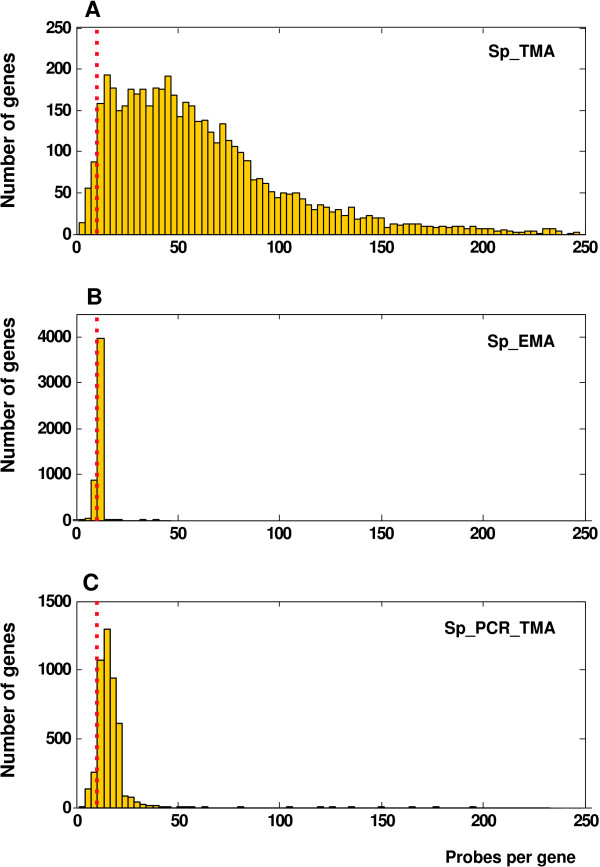
Figure 2.
Frequency of probes per gene in custom CDFs. The dashed red line indicates the 11-nucleotide boundary. A) 96.8% of all S. pombe genes are represented by more than 10 probes in Sp_TMA CDF. B) 11.7% and 80.9% of all genes are represented by 10 or 11 probes, respectively, in Sp_EMA CDF. C) 91.5% of all genes are represented by more than 10 probes in Sp_PCR_TMA CDF.

