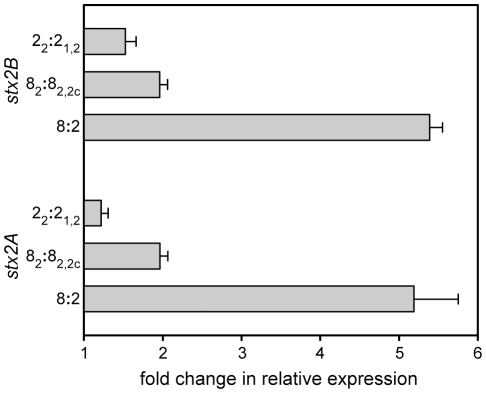
Figure 5. Differences in expression of Stx2 genes within and between clades, as determined by qRT-PCR.
Labels on the ordinate represent cladestx profiles of examined strains. Differences in expression are plotted as average fold change ratios, with standard deviations, of clade 8 (n = 6) to clade 2 (n = 6) strains; for within clade comparison, averages of 3 strains per group are compared.

