FIGURE 4.
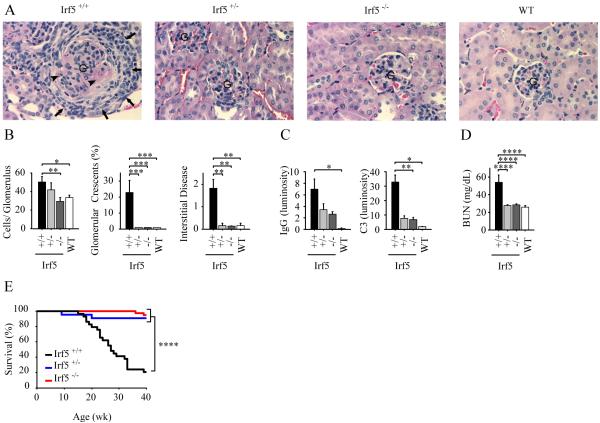
Decreased renal disease and enhanced survival in IRF5-deficient RII.Yaa mice. A and B, Irf5+/+ (n = 12), Irf5+/− (n = 12), and Irf5−/− (n=14) RII.Yaa mice and wildtype (WT) mice (n=12) were analyzed at 5 months of age. A, Representative renal histology. G indicates glomerulus. Arrows indicate cellular crescent. Arrowheads indicate necrotic areas within glomerulus. B, Quantitation of renal disease as shown by cell number per glomerulus, percentage of glomeruli with crescents, and interstitial disease score. C, Glomerular IgG and complement C3 deposition measured by fluorescence intensity (luminosity) in Irf5+/+ (n = 6), Irf5+/− (n = 3), Irf5−/− (n=6) RII.Yaa mice and WT mice (n = 4). D, Serum blood urea nitrogen (BUN) levels in Irf5+/+ (n = 10), Irf5+/− (n = 11), Irf5−/− (n=14) RII.Yaa mice and WT mice (n = 10). Data are presented as mean ± SEM. *, p < 0.05; **, p< 0.01; ***, p < 0.001; ****, p < 0.0001 by Mann-Whitney U test. E, Irf5+/+ (black line, n = 29), Irf5+/− (blue line, n = 22), and Irf5−/− (red line, n=38) RII.Yaa mice were observed until the time of death. ****, p < 0.0001, logrank test.

