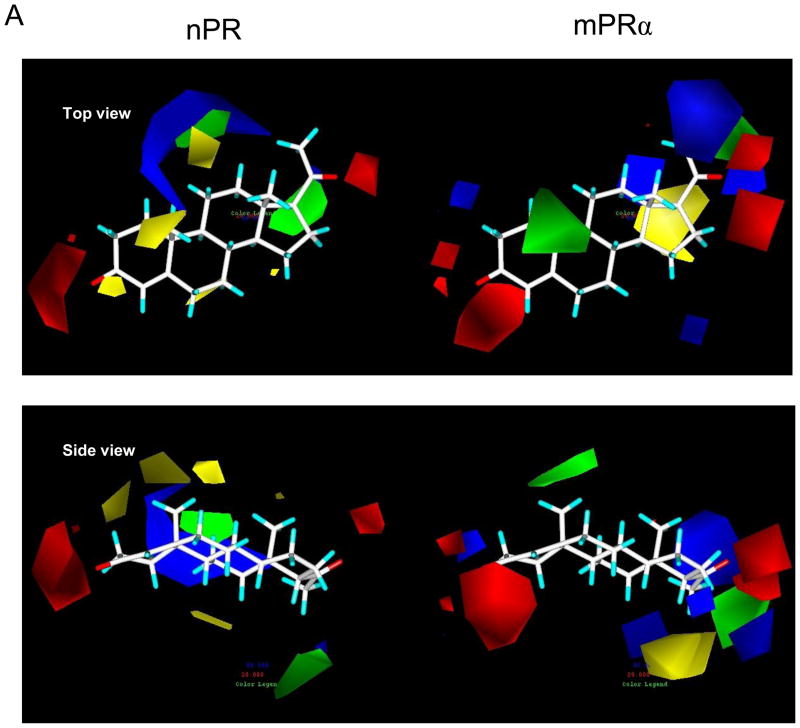
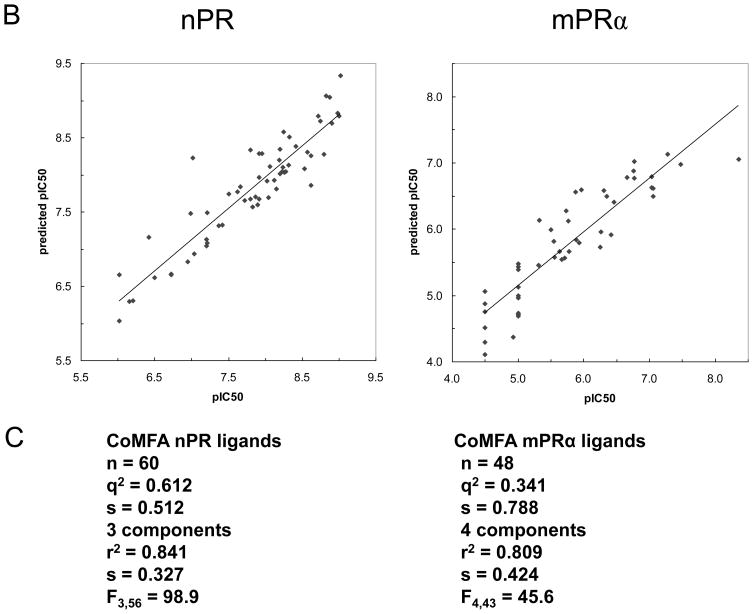
Figure 6.
Physicochemical properties of steroid binding to mPRα (on right) and nPR (on left) assessed by comparative molecular field analyses (CoMFA) A. CoMFA steric and electrostatic field contour plots for the mPRα and nPR models. Progesterone is shown as the reference compound in the top view and the side view. The green volumes indicate favourable steric interactions and the yellow volumes represent unfavourable steric interactions. The red volumes indicate regions where the presence of negative potential contributes to the affinity. The blue volumes indicate regions where the presence of positive potential increases binding affinity. B. Plots of CoMFA predicted vs measured pIC50 values of 48 mPRα ligands and 60 nPR ligands. C. Details of the two CoMFA analyses using the pIC50 values of 48 mPRα ligands and of 60 nPR ligands. The structures of all the ligands are shown in Supplementary Table 1.


