
Figure 2.
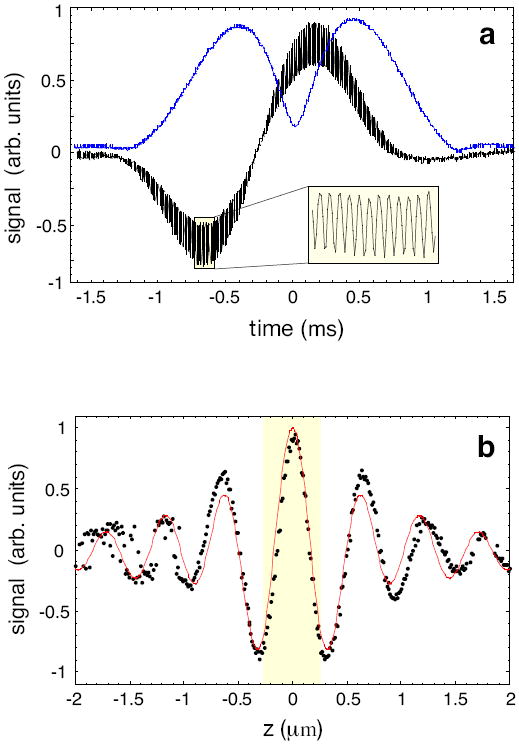
Experimental signals recorded with a test particle scanned through the laser focus. (a) The black curve shows the raw detector signal according Eq. (2) and the blue curve is the demodulated modulus A. The amplitude of A is a measure for the particle polarizability α. (b) Demonstration of the phase sensitivity of homodyne detection. The figure shows the maximum value of Sx recorded by scanning a test particle through the laser focus in different transverse planes z = const. The shaded region corresponds to the width of the nanofluidic channels used in our experiments. Phase variations across the nanochannel dimensions have a strong influence on the signal strength of Sx (homodyne detection). Dots: experimental data; red curve: theoretical curve.