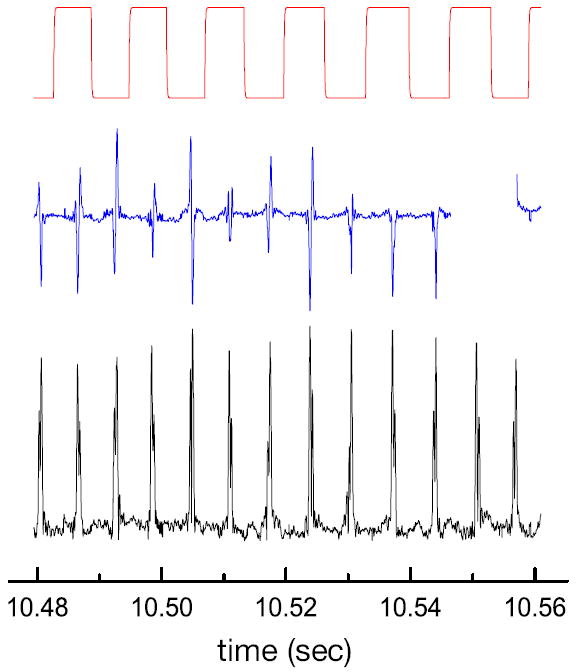
Figure 4.

Time trace for a single 75 nm polystyrene particle repeatedly passing through the laser focus. The figure shows the periodic switching of the electroosmotic potential (top), the homodyne signal Sx(t) (center), and the heterodyne signal A(t) bottom. It is evident that the signal variations between detection events are lower for A(t) than for Sx(t), proving that the elimination of phase variations due to different particle trajectories improves the detection accuracy.
