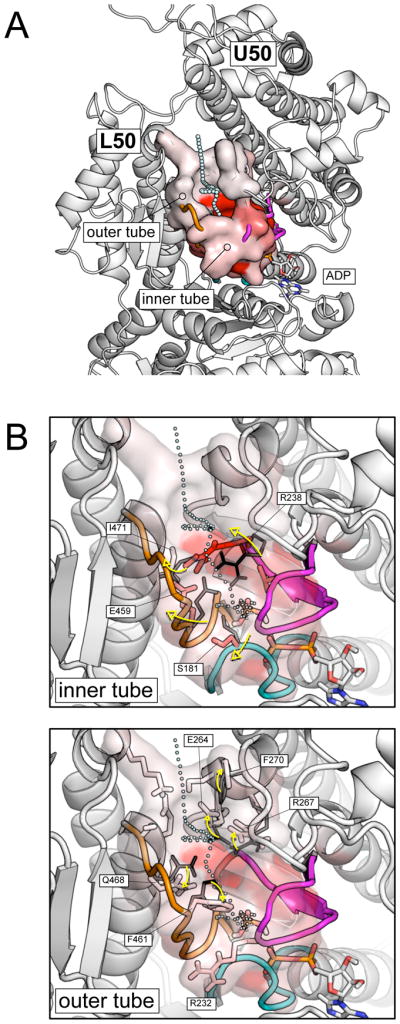
FIG. 4.

Pi release from the pre-powerstroke state. (A) A pictorial representation of the most populated exit pathway (backdoor I) from the pre-powerstroke myosin in the post-release temperature range (T > 2000 K). The exit path is shown by cyan spheres; the molecular surface of the residues making up the exit tube is color-coded from white to red according to the number of contacts they make with the phosphate along the simulations; i.e., the red color corresponds to a fraction of contacts close to one, the white color to a fraction close to zero. The exit pathway is located between the U50 and L50 subdomains and is composed of a short “inner tube”, which cages the Pi in the interior of the protein, and a longer “outer tube”, which involves two successive layers of residues. (B) Local conformational rearrangements in the inner (top) and the outer tube (bottom) that allows the release of Pi. The P-loop, switch I and switch II are shown in cyan, magenta, and orange, respectively. Residues identified by the rotameric analysis as playing a role in gating Pi are labeled. Black thin and white to red color-coded thick sticks show the equilibrium and the release-prone conformations of the identified residues.
