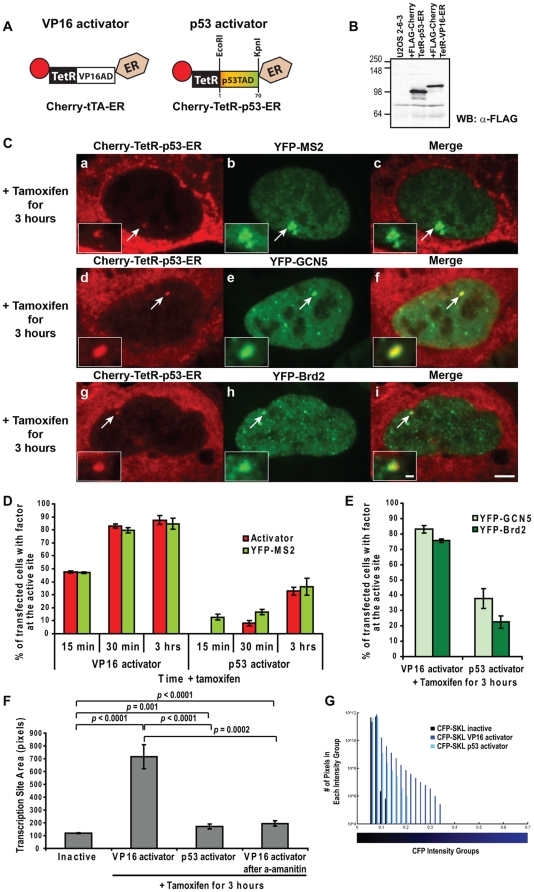
Figure 9. Single cell analysis of transcriptional activation induced by VP16 and p53 activators.
(A) Schematic representation of the VP16 and p53 activators. (B) Western blot analysis of Flag-tagged versions of the p53 and VP16 activators showing that they are expressed at comparable levels in 2-6-3 cells. (C) YFP-MS2 (panels a–c), YFP-GCN5 (panels d–f), and YFP-Brd2 (panels g–i) are enriched at the transcription site, marked by Cherry-tTetR-p53-ER. Scale bar represents 5 µm. Scale bar in enlarged inset represents 1 µm. (D) Analysis of the percentage of cells with the activators and YFP-MS2 enriched at the transcription site 15 min, 30 min, and 3 hr after activation. 100 cells were analyzed from 3 independent experiments; SEMs (in the form of error bars) are presented in the graphs. (E) Analysis of the percentage of cells with accumulations of YFP-GCN5 and YFP-Brd2 at the transcription site 3 hr after activation. 100 cells were analyzed from 3 independent experiments; SEMs (in the form of error bars) are presented in the graphs. (F) Measurement of the pixel area of the transcription site in the inactive state (marked by Cherry-lac repressor) and after 3 hrs activation by the VP16 activator (Cherry-tTA-ER with and without α-amanitin pre-treatment) and the p53 activator (Cherry-TetR-p53-ER). Inactive and VP16-activated transcription site data is the same as in Fig. 1D. Area values are averages of 10 cells. SEM (in the form of error bars) and p values are presented in the graph. (G) Frequency histogram showing the distribution of the blue pixel intensity levels (blue bars) as a measure of the CFP-SKL protein in cells activated for 3 hrs by the VP16 and p53 activators. Black bars represent the background signal. The x-axis is the average fluorescence pixel intensity in each bin on a scale from 0 to 1 and divided into bin sizes of 0.02; the y-axis is the number of pixels in each bin, on a logarithmic scale. The bar beneath the histogram shows the intensity range. Measurements are from 5 independent experiments. Data for the inactive and VP16-activated cells is from the graph in Fig. 1E.

