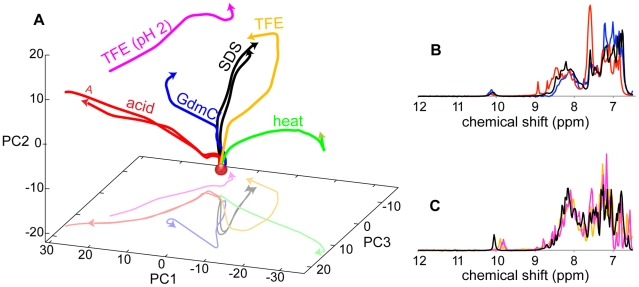
Figure 4. GPS NMR overview of apo BLA perturbed by addition of SDS, GdmCl, or TFE, by changes in pH, or heating.
GPS NMR 3D score plot (A) for titrations of apo BLA with SDS (0–56 mM; black), pH (pH 7.0–2.0; red), GdmCl (0–3 M; blue), TFE (0–50%; orange), TFE at pH 2.0 (0–50%; pink), and heating (283–333 K; green). SDS titrations at 700 and 400 are included. The lighter lines show projections on the PC1-PC3 plane. The scores of pure apo BLA and the A-state are indicated by a red dot and an italic A, respectively. Colored numbers indicate turning/end-points of the various titrations. (B, C) Overlays of NMR spectra of partially folded states (B) induced by 5 SDS molecules/protein (black), 1.6 M GdmCl (blue), and addition of acid to pH 2 (red), and (C) by 22 SDS/BLA (black), 50% TFE (orange), and 50% TFE at pH 2 (pink).

