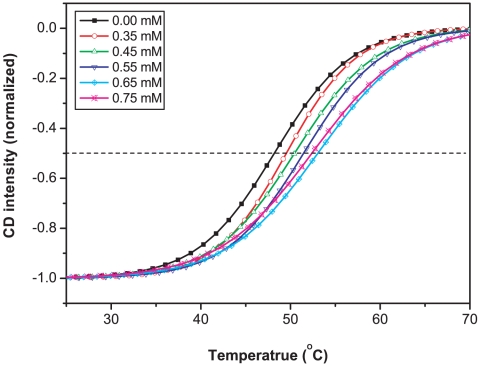
Figure 4. Temperature dependence of CD signal of PS-I at 689 nm as a function of I5K2 concentration.
Sigmoidal curves were normalized to the lowest point. Data determination and analysis were the same as in Figure 2. Curves were fitted with equation 1.

