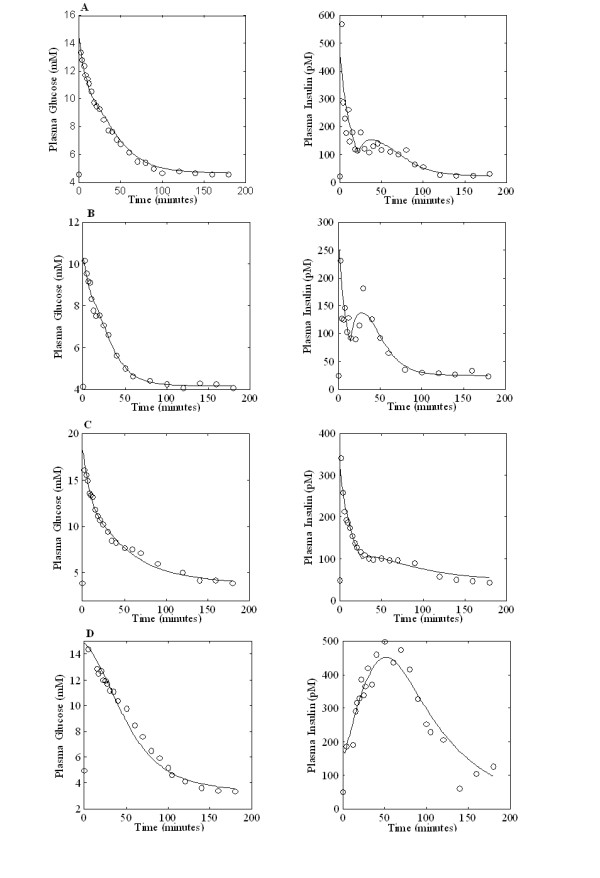
Figure 2.

Glucose and Insulin observed concentrations (circles) along with their Single Delay Model time predictions (continuous line) for four subjects belonging to different BMI classes. Panel A: one subject with BMI ≤ 24, Panel B: one subject with 24 < BMI ≤ 30, Panel C: one subject with 30 < BMI ≤ 40, Panel D: one subject with BMI > 40
