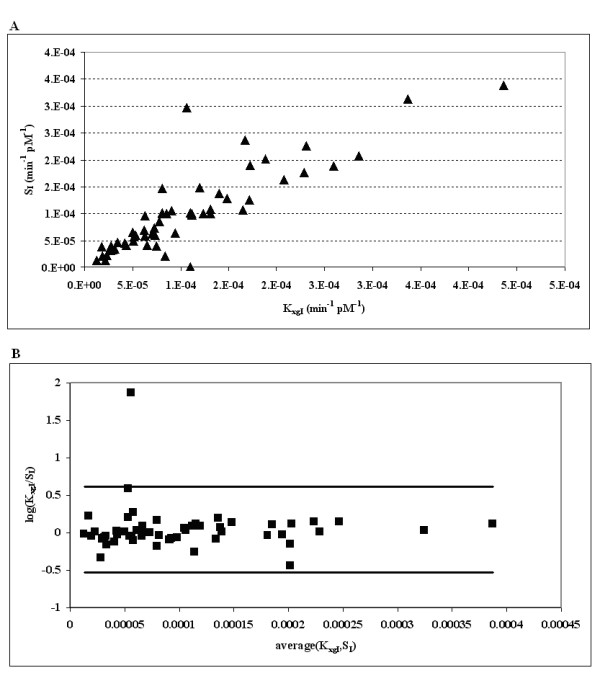
Figure 4.

Panel A: scatter plot of the two Insulin Sensitivity Indices from the Single Delay Model (KxgI) and from the Minimal Model (SI) on the reduced Sub-Sample obtained eliminating the 18 extreme-SI subjects. Panel B: Bland-Altman Procedure; on the abscissas are reported the averages of each pair of Insulin Sensitivity Indices (one from the Single Delay Model KxgI and one from the Minimal Model SI) from the reduced Sub-Sample (obtained eliminating the 18 extreme-SI subjects); on the ordinates are reported the logarithms of the ratios between each subject's KxgI and SI.
