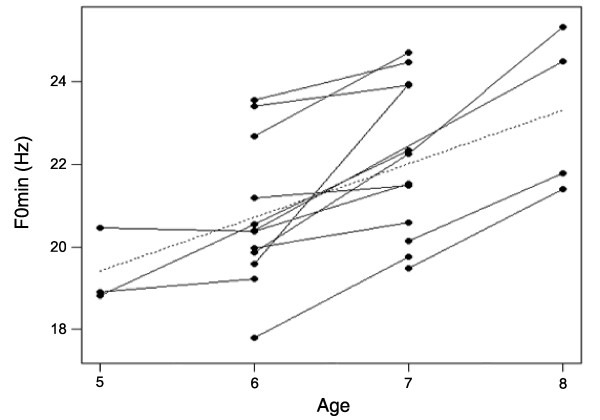
Figure 3.
Relationship between the age of males and the minimum fundamental frequency of groans. The minimum fundamental frequency increases as males get older (linear relationship). Dots represent mean values per year for each male and lines show repeated measures of the same individual across years.

