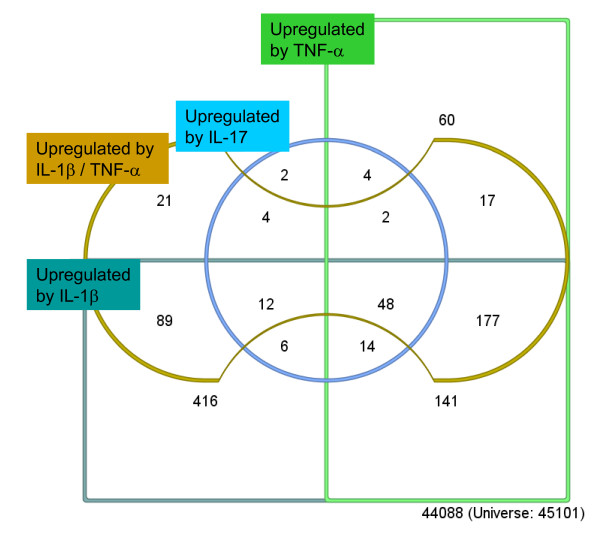
Figure 1.
Venn Diagram describing relationships between up-regulated probe sets transcripts after treatment of hepatocytes with different cytokines or combinations thereof. Genes up-regulated by IL-1β (dark green; 903 probe sets, ST q-value < 0.00018) and TNF-α (green; 463 probe sets, ST q-value < 0.0014) are located within the two rectangles, genes up-regulated by IL-17 stimulation (blue: 92 probe sets, ST q-value < 0.012) in the centre circle and genes up-regulated by combined stimulation of TNF-α and IL-17 (brown, 370 probe sets, ST q-value < 0.0014) in the bone shaped structure.

