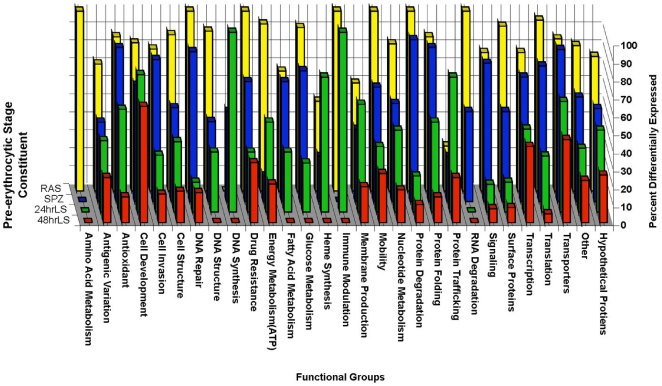
Figure 1. Functional grouping of genes differentially expressed during the pre-erythrocytic stage.
All genes identified using significance analysis for microarray (SAM, FDR <1%) to be differentially expressed relative to the mixed blood stages were grouped based on the annotated functions of the proteins they encode. The percent of the total number of genes identified to be differentially expressed at any point during the pre-erythrocytic stage relative to the mixed blood stages that belong to an individual functional group (listed on the x-axis) that were differentially expressed in a particular pre-erythrocytic stage constituent (listed on the z-axis: RAS, yellow bars; wtSPZ, blue bars; 24hrLS, green bars; or 48hrLS, red bars) was plotted on the y axis.

