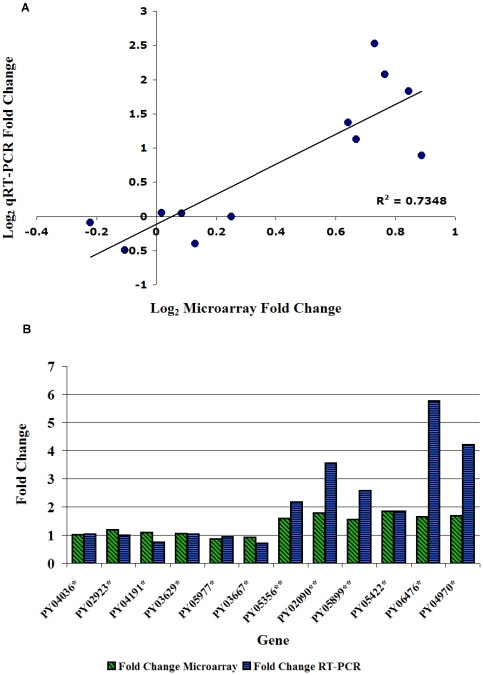
Figure 2. Validation of microarray results.
Quantitative real time PCR (qRT-PCR) was performed on select genes found to be differentially expressed in the microarray analysis. A. The log2 of fold change in the microarray was plotted against the log2 of fold change derived from real time PCR to estimate the correlation between the microarray results and the real time PCR results. B. Actual fold change from microarray analysis (green bars) and qRT-PCR (blue bars) were graphed side by side. * fold change was calculated wtSPZ expression divided by RAS expression, ** fold change was calculated 24hrLS expression divided by 48hrLS expression.

