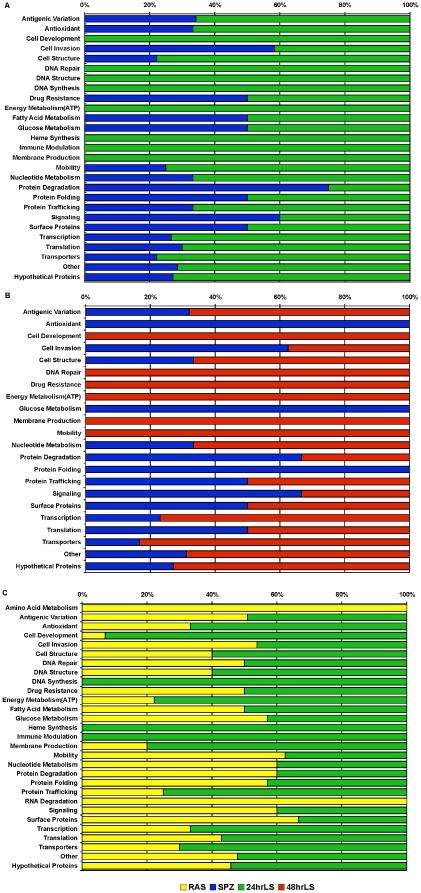
Figure 3. Transcriptional comparisons of pre-erythrocytic stage constituents.
Statistical Analysis for Microarray (FDR <10%) was used to identify genes significantly differentially expressed when the wild type sporozoite (SPZ) transcriptome was compared with the transcriptome of 24 hr liver stage parasites (24hrLS). The significantly differentially expressed genes were placed into functional groups based on the annotated functions of the encoded proteins. The percent of the total number of genes within a particular functional group that are upregulated in wtSPZ compared to 24hrLS are graphed in blue bars and the percentage upregulated in 24hrLS relative to wtSPZ is graphed in green bars. Similar comparisons were made between B. wtSPZ, blue bars, and 48hr liver stage parasites (48hrLS), red bars, as well as between C. radiation attenuated sporozoites (RAS), yellow bars, compared with 24hrLS, green bars.

