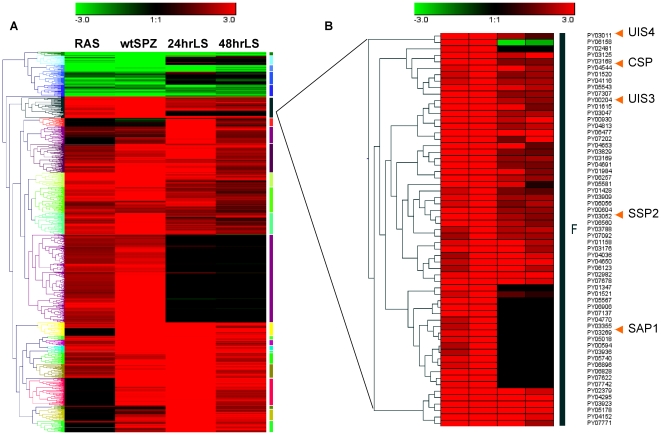
Figure 5. Hierarchical cluster analysis.
A. Dendrogram of hierarchical clustering of the gene expression profiles of all genes found to be differentially expressed in any or all of the pre-erythrocytic stage samples tested relative to the mixed blood stages. The colored bars to the right indicate the resulting twenty-three clusters. Biological relevance of the resulting clusters was assessed by comparing the annotated functions of members of several clusters, for example Cluster F shown in panel B.

