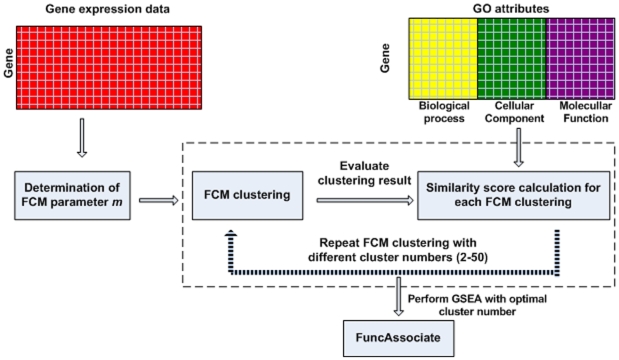
Figure 2. The FCM clustering scheme.
The scheme illustrates the process of grouping genes into biologically meaningful clusters. The gene expression data were first utilized to find the optimal m value for FCM clustering. With the optimal m value, FCM clustering was performed on gene expression data for cluster numbers ranging from 2 to 50. The similarity scores of all pairs of genes in each cluster of one partition are averaged and denoted as overall similarity score for one cluster partition. The partition with the highest similarity score was selected as the optimal one. GSEA was performed using FuncAssociate to evaluate the gene clusters formed using the optimal cluster number.

